
Advertiser Partner Portal
(last updated: May 27, 2025)
Welcome to the Thanks Advertiser Portal
This dashboard helps you track campaign performance across our network in real time. You’ll find insights on how users are engaging with your ads — from views to conversions — and can filter and export data to optimize your strategy.
Accessing Your Account
- Ensure a member of the Thanks team has granted you access.
- Go to advertisers.thanks.co.
- Create your account (or sign in if you already have an account).
What You Can Do
- View performance by day, week, or month.
- Export your data (
.xlsx) for further analysis. - Monitor key metrics like clicks, conversions, CTR, CVR, and estimated spend.
Key Metrics Explained
- Views – Number of times the ad has been shown to users.
- Clicks – Number of times users clicked the ad.
- Conversions – Number of users who completed your desired action (e.g., sign-up, purchase).
- CTR (Click-Through Rate) –
Clicks ÷ Views × 100. - CVR (Conversion Rate) –
Conversions ÷ Clicks × 100. - Estimated Cost – Estimated total spend based on your pricing model (CPC or CPA).
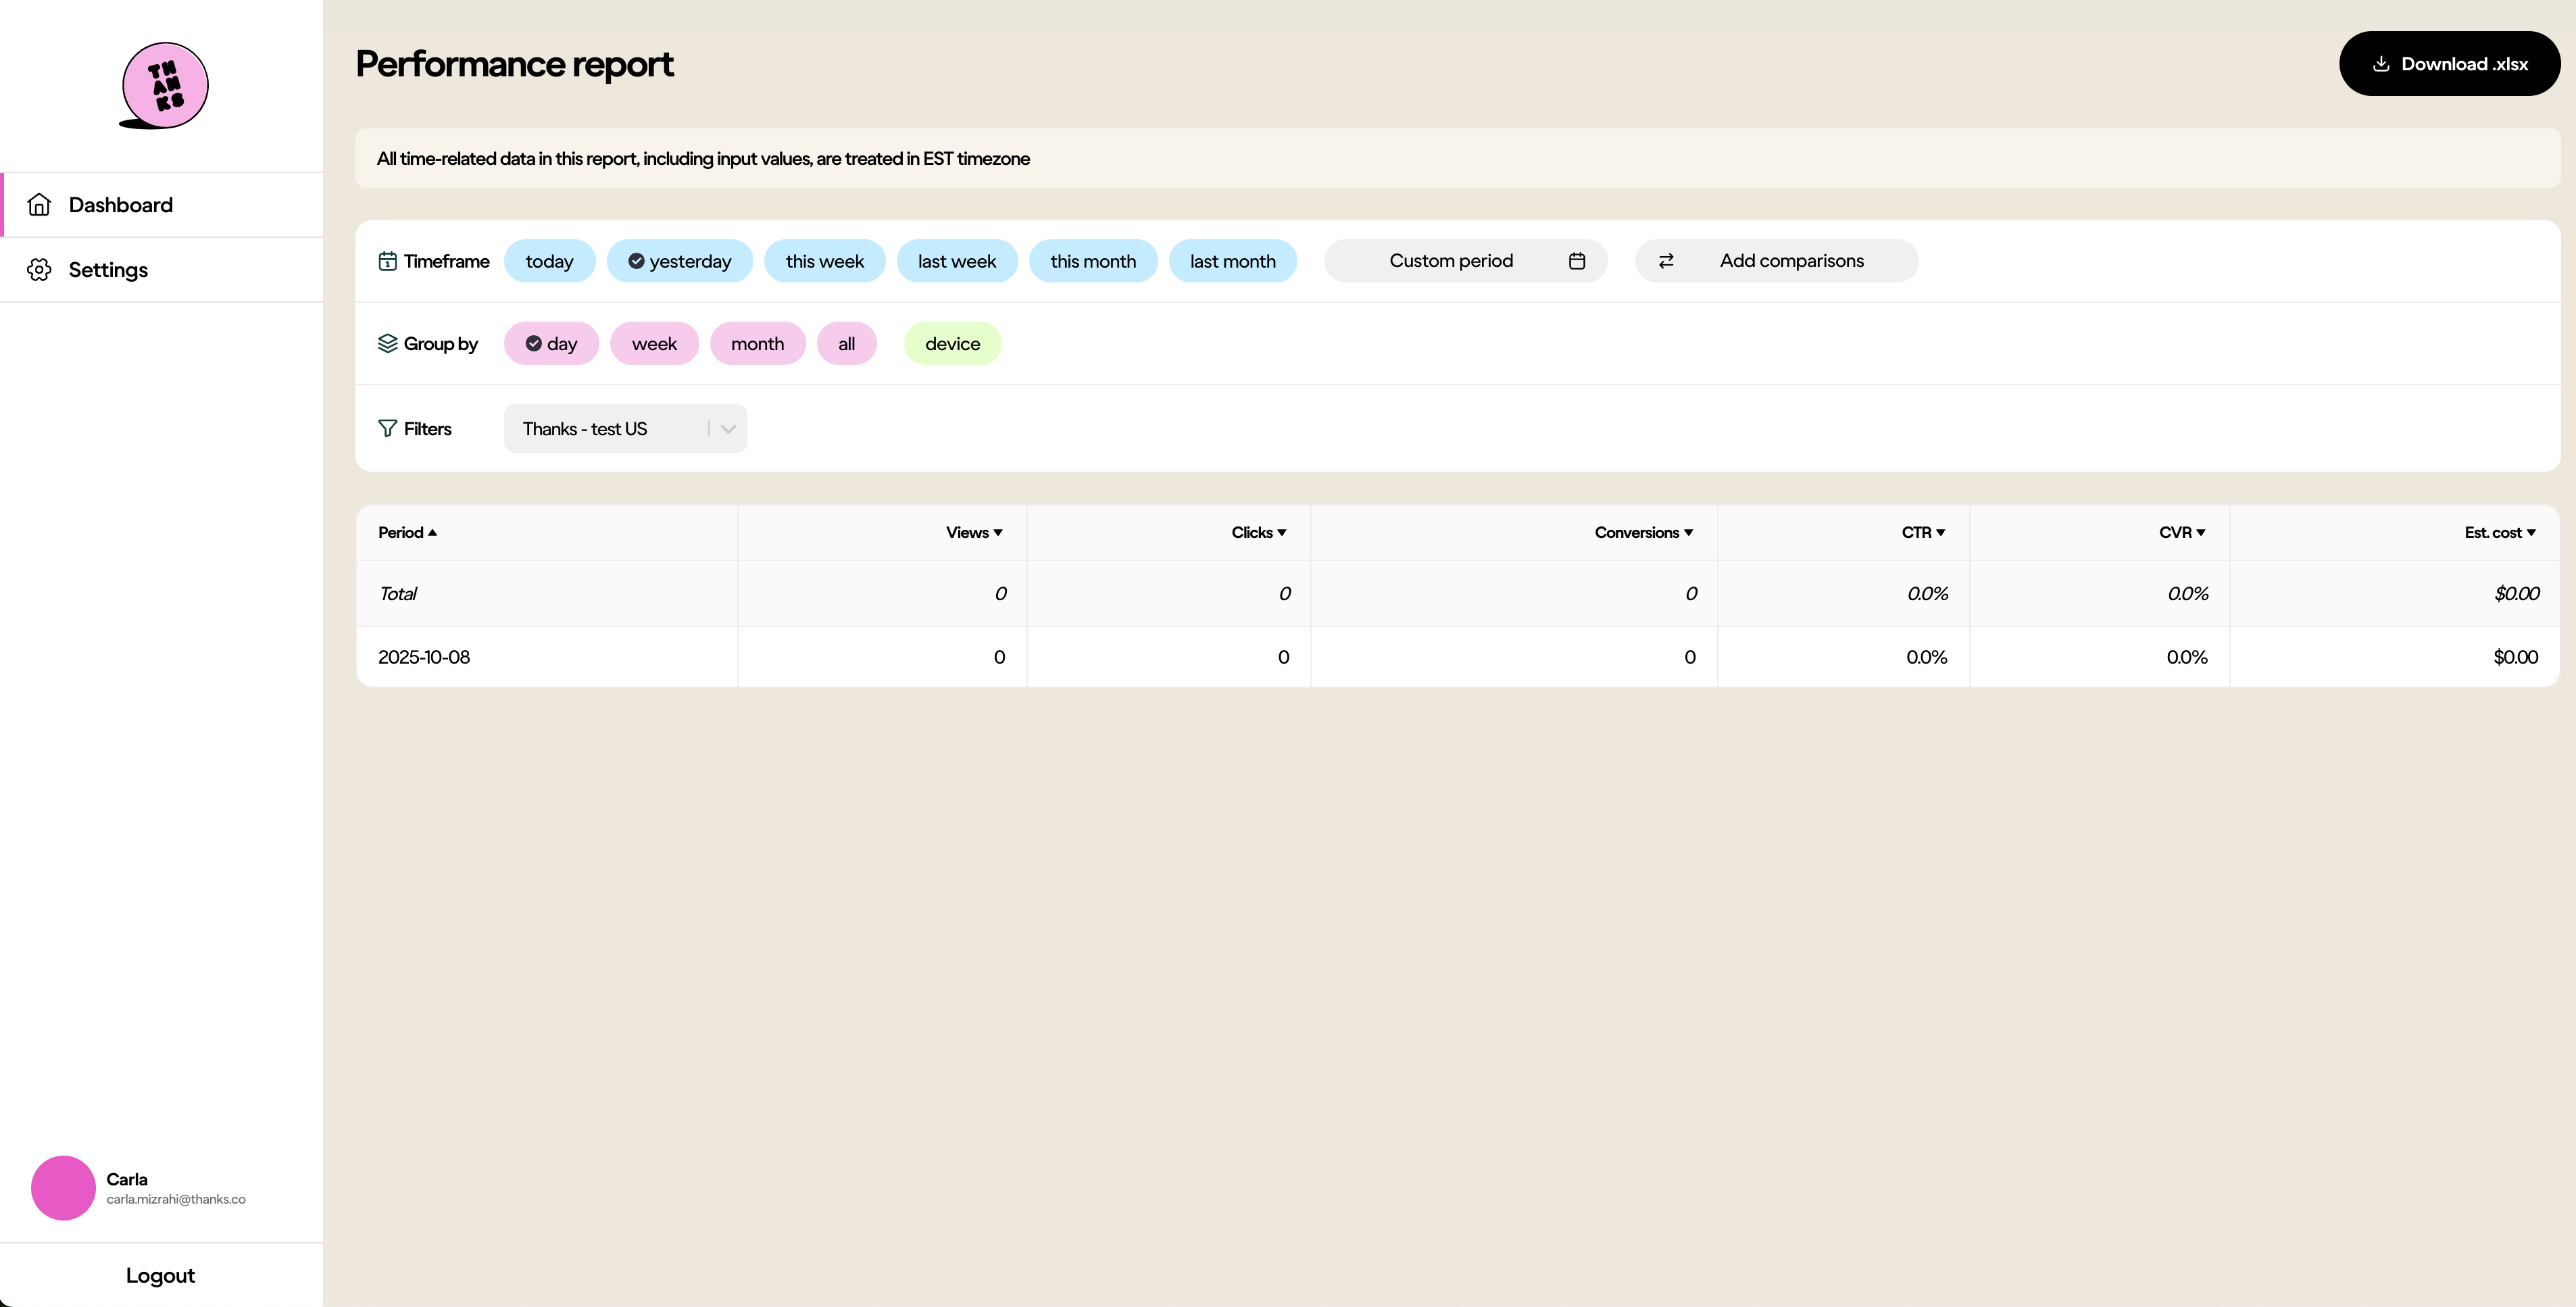
Example Report
Need Help?
Contact your Account Manager or email [email protected].
Updated 4 months ago
Did this page help you?